
AI Sales Dashboard Metrics That Actually Predict Closed Deals
Author: Moeez Ullah Published Date: August 23, 2026

AI Sales Dashboard Metrics That Actually Predict Closed Deals
Most sales dashboards are full of numbers that feel important but don't move the forecast: calls made, emails sent, meetings booked. They measure effort, not outcome. A rep can hit every activity target this quarter and still miss their number, because activity volume and deal probability aren't the same thing.
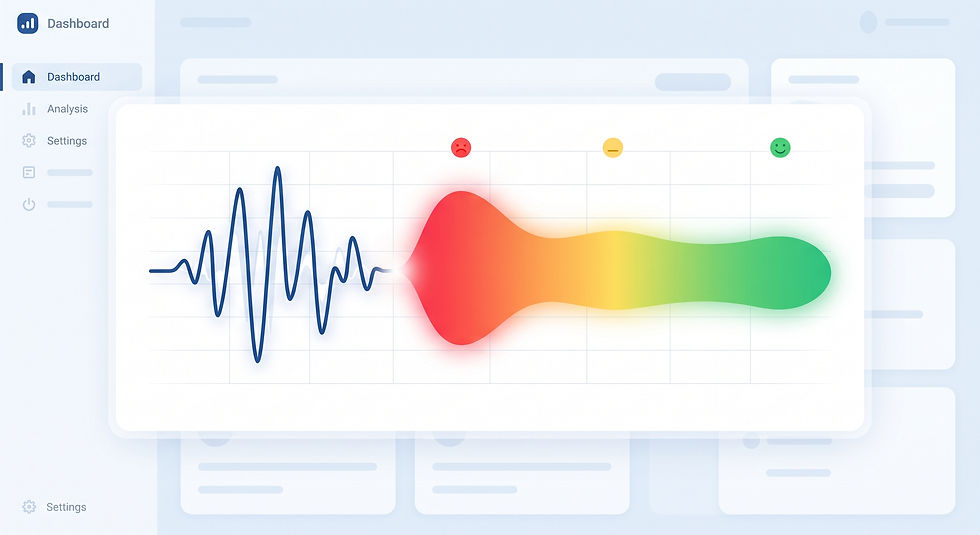
AI-driven sales dashboards are starting to change what gets measured — replacing pure activity counts with signals pulled directly from conversations: engagement quality, response patterns, and sentiment trends that correlate much more closely with what actually closes.
Why Activity Metrics Alone Mislead Sales Leaders
Volume Hides Quality
50 calls a week sounds strong until you see that 40 of them lasted under 90 seconds. Activity dashboards count the call; they don't tell you whether a real conversation happened.
Lagging Indicators Arrive Too Late
Win rate and quota attainment are accurate — and useless for mid-quarter course correction, because by the time they show a problem, the quarter is already lost.
Every Rep Looks the Same on a Leaderboard
Two reps with identical call counts can have completely different pipelines — one full of engaged, responsive prospects, the other full of stalled contacts. A leaderboard sorted by activity won't show that difference.
The Metrics That Actually Correlate With Closed Deals

Metric | What it measures | Why it predicts outcomes better than activity volume |
Talk-to-listen ratio | How much the rep talks vs. the prospect | Deals with more prospect talk time close more often it signals genuine engagement, not a monologue |
Response velocity | How fast a lead replies to outreach | Fast reciprocal response time is one of the strongest early buying signals |
Sentiment trend across calls | Whether tone is improving or declining call over call | A cooling sentiment trend flags at-risk deals before they're formally lost |
Objection resolution rate | Whether raised objections get addressed before the next call | Unresolved objections are a leading cause of stalled deals |
Multi-thread engagement | Number of distinct stakeholders actively engaging | Single-threaded deals close far less often than multi-threaded ones |
Building a Dashboard Around These Signals
Pull Metrics From Conversations, Not Just CRM Fields
Talk-ratio, sentiment, and objection data don't exist in a standard CRM field — they have to be extracted from the call and message content itself. This is where AI conversation analysis (rather than manual CRM entry) becomes the actual data source for the dashboard.
Rank Deals by Signal Strength, Not Just Stage
A deal sitting in "Proposal Sent" for three weeks with declining sentiment is a different risk profile than one in the same stage with rising engagement — but a stage-only dashboard shows them identically.

Deal | Stage | Sentiment trend | Multi-thread engagement | Risk flag |
Acme Corp | Proposal Sent | Declining | Single stakeholder | High risk |
Nova Retail | Proposal Sent | Improving | 3 stakeholders | On track |
Delta Labs | Demo Complete | Stable | 2 stakeholders | Monitor |
(The point is that stage alone doesn't tell you which deals need attention this week.)
Give Reps a Weekly Signal Summary, Not Just a Number
A rep is more likely to act on "3 of your deals show declining sentiment" than on an abstract quota percentage the signal points directly to what to do next.
Rolling This Out: A Practical Checklist
Audit your current dashboard: flag which metrics measure activity vs. outcome.
Add at least one conversation-derived signal: (sentiment trend or talk ratio) alongside existing pipeline metrics.
Set a risk threshold, e.g., flag any deal with declining sentiment two calls in a row.
Review flagged deals in weekly pipeline meetings, not just stage and close date.
Retire vanity metrics that don't correlate with your own historical win data — not every activity number deserves dashboard space.
Measure What Predicts, Not What's Easy to Count
Dashboards built around activity volume feel productive but rarely tell a sales leader who's actually about to close — or who's quietly slipping away. Metrics pulled directly from real conversations get closer to that answer, earlier.
Book a demo to see how WKPhoneAI turns call and message data into a dashboard built around signals that predict outcomes.
Frequently Asked Questions
Do I need a separate tool for conversation-based metrics, or can my CRM do this?
Standard CRMs track manually entered fields; conversation-derived metrics like sentiment and talk ratio require a system that analyzes call and message content directly.
How often should sentiment trends be reviewed?
Weekly is typical for active pipeline review frequent enough to catch a declining trend before a deal stalls completely.
Is talk-to-listen ratio a hard rule?
No, it's a directional signal. A very low prospect talk ratio across multiple calls is worth investigating, not an automatic red flag on its own.


Comments